One of the primary ways of visualizing the state of a telemetry system in DataWise® is through sensor readings placed on a map. The type of sensor readings placed on a map is controlled by specifying different categories of sensor types each measuring the same type of physical element.
In most cases, there is only one sensor type in a category (e.g., air temperature, wind speed, etc.). However, there are cases in which two different sensor types can be grouped into a single category.
For example, there may be times when two types of rainfall measurements are taken in a telemetry system, accumulating rainfall (e.g., tipping bucket) and incremental rainfall in which the telemetered data reports 15-minute or hourly rainfall amounts. By defining a rainfall category containing both types of rainfall sensors, the data for both types can be displayed on the map.
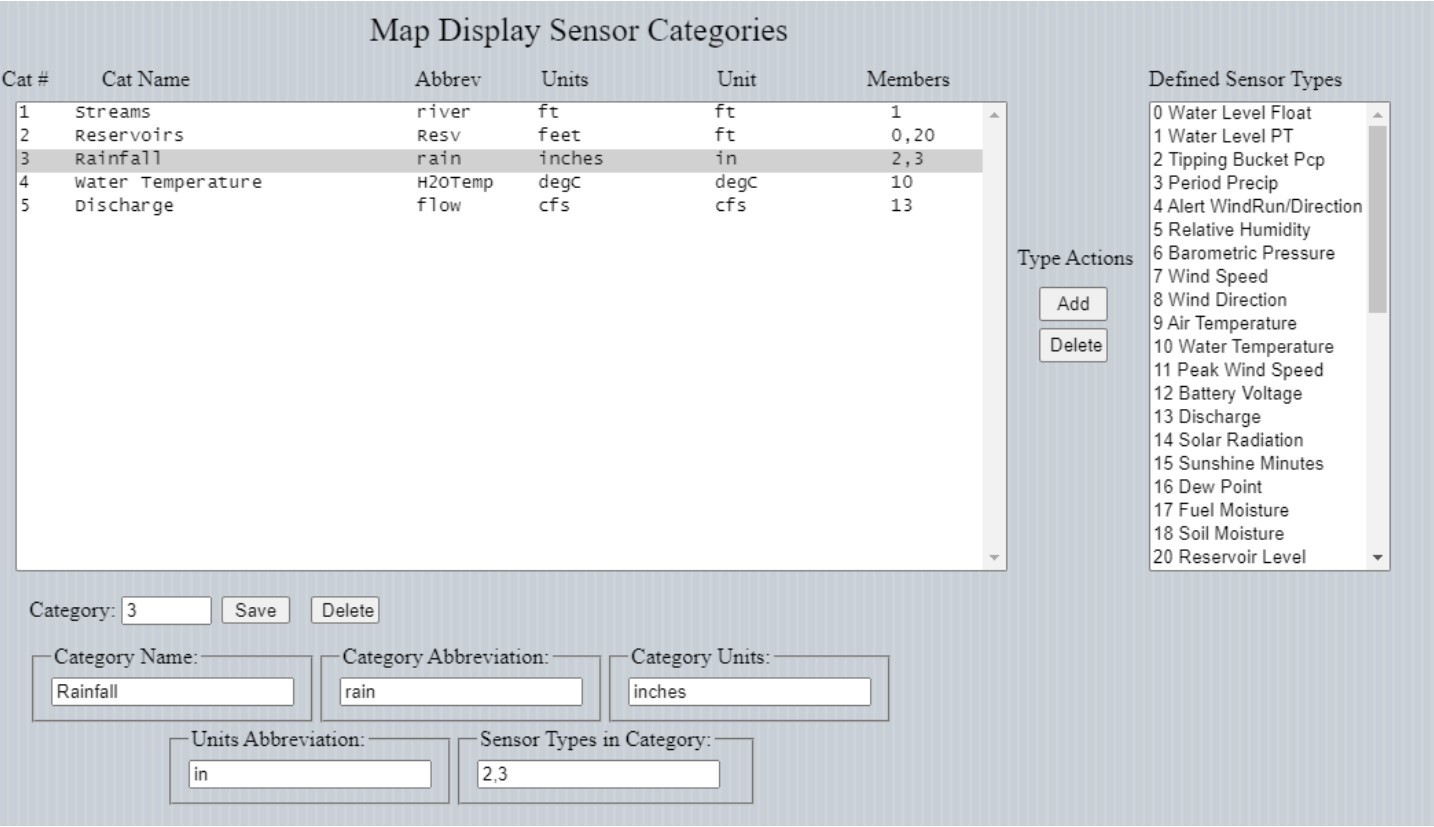
Map Display Sensor Category Configuration.