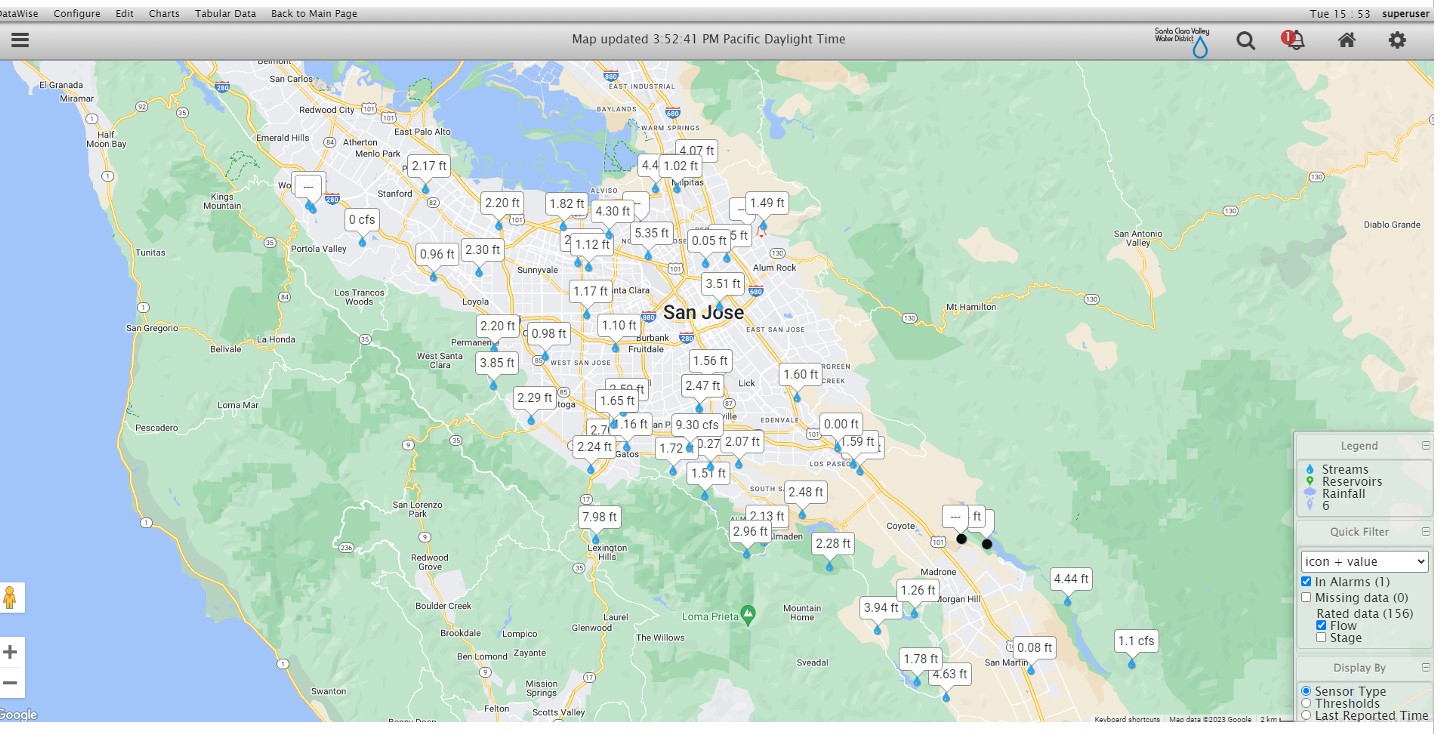
The figure below shows water level data being displayed on a GIS Map. Note that sensor readings will update in real-time as new data is received.
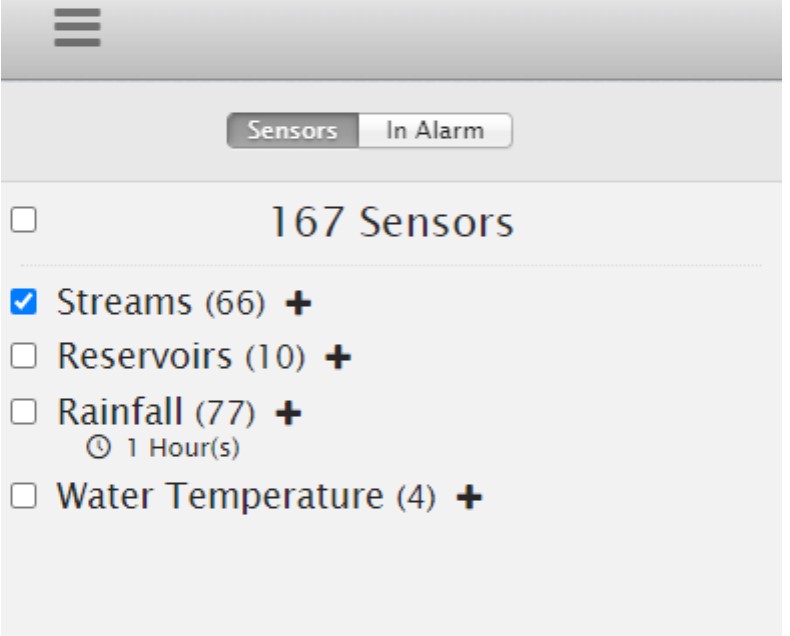
Clicking on the 4 parallel lines in the upper left-hand panel will cause a side-panel to be displayed as shown in figure below.
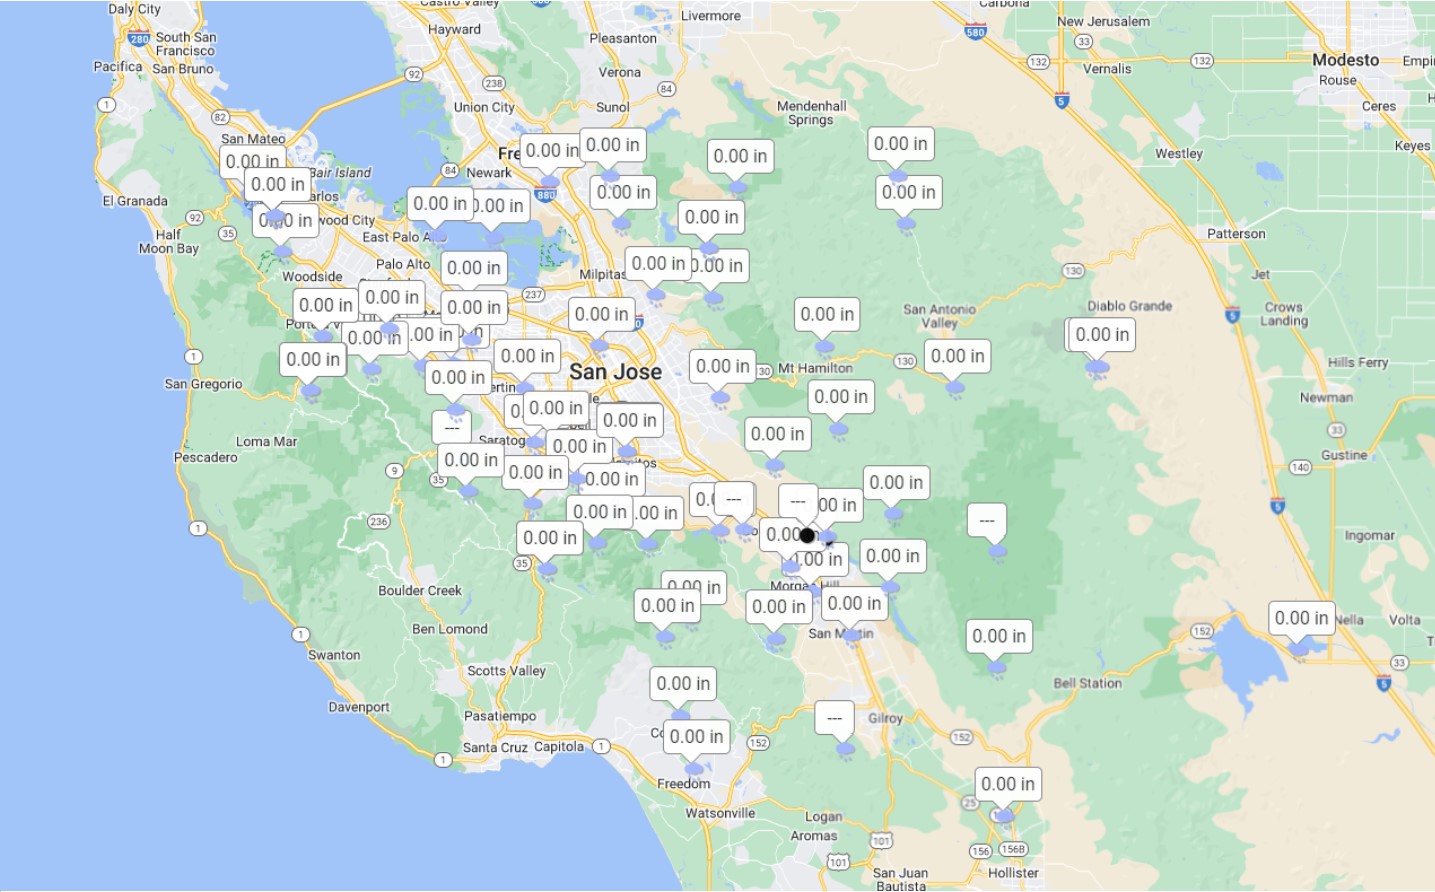
Rainfall data can be displayed and streams (or water level) can be hidden by un-checking the Streams and checking the Rainfall box.
The display below will be shown: