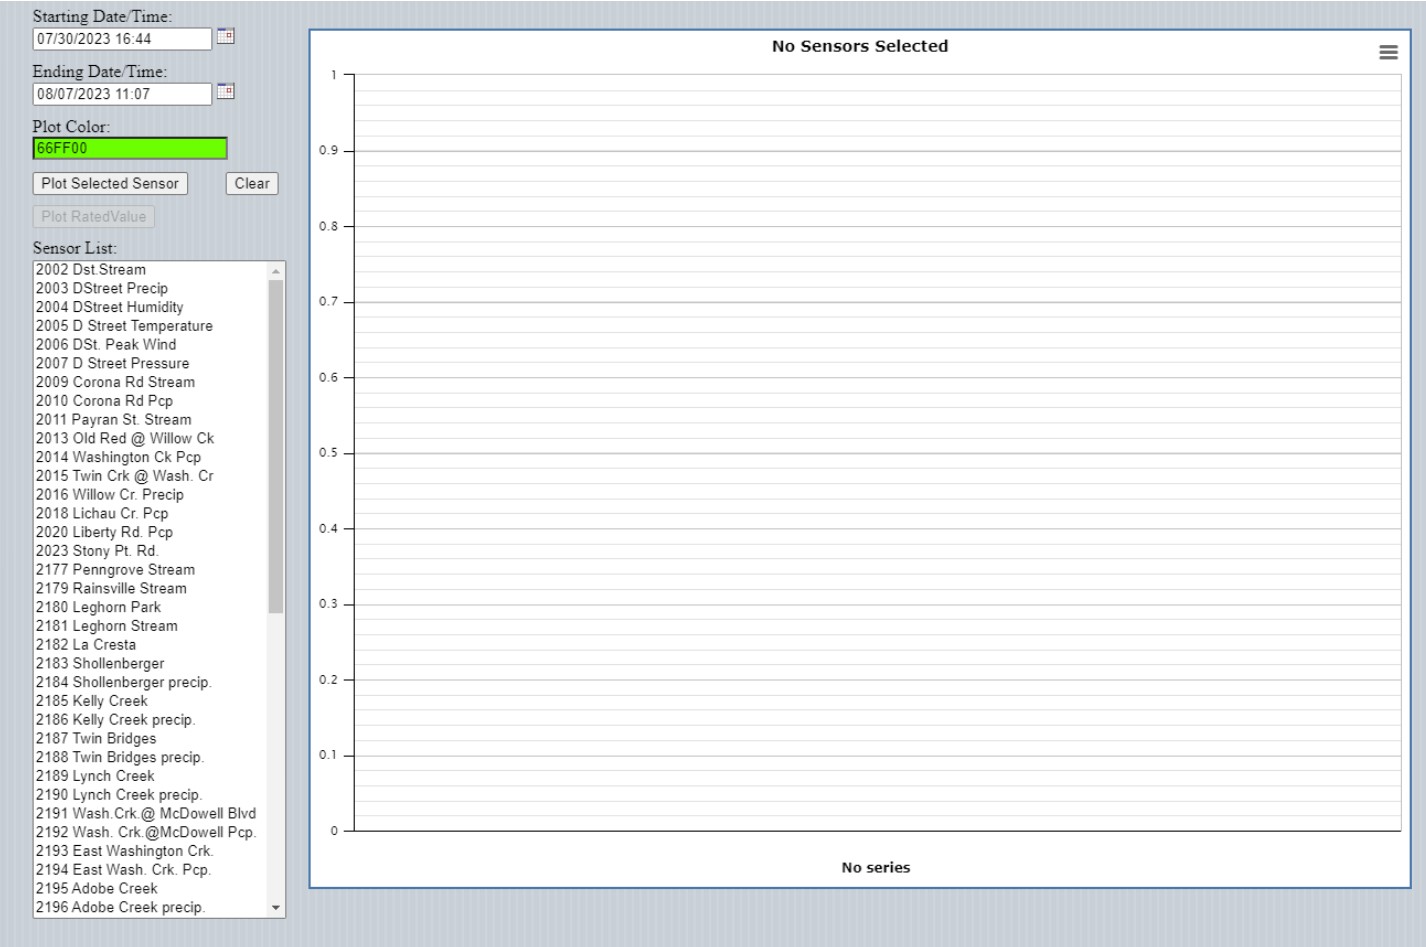
To produce a time series plot, select "Timeseries Plots" from the "Charts" drop-down menu. The display shown below will be shown:
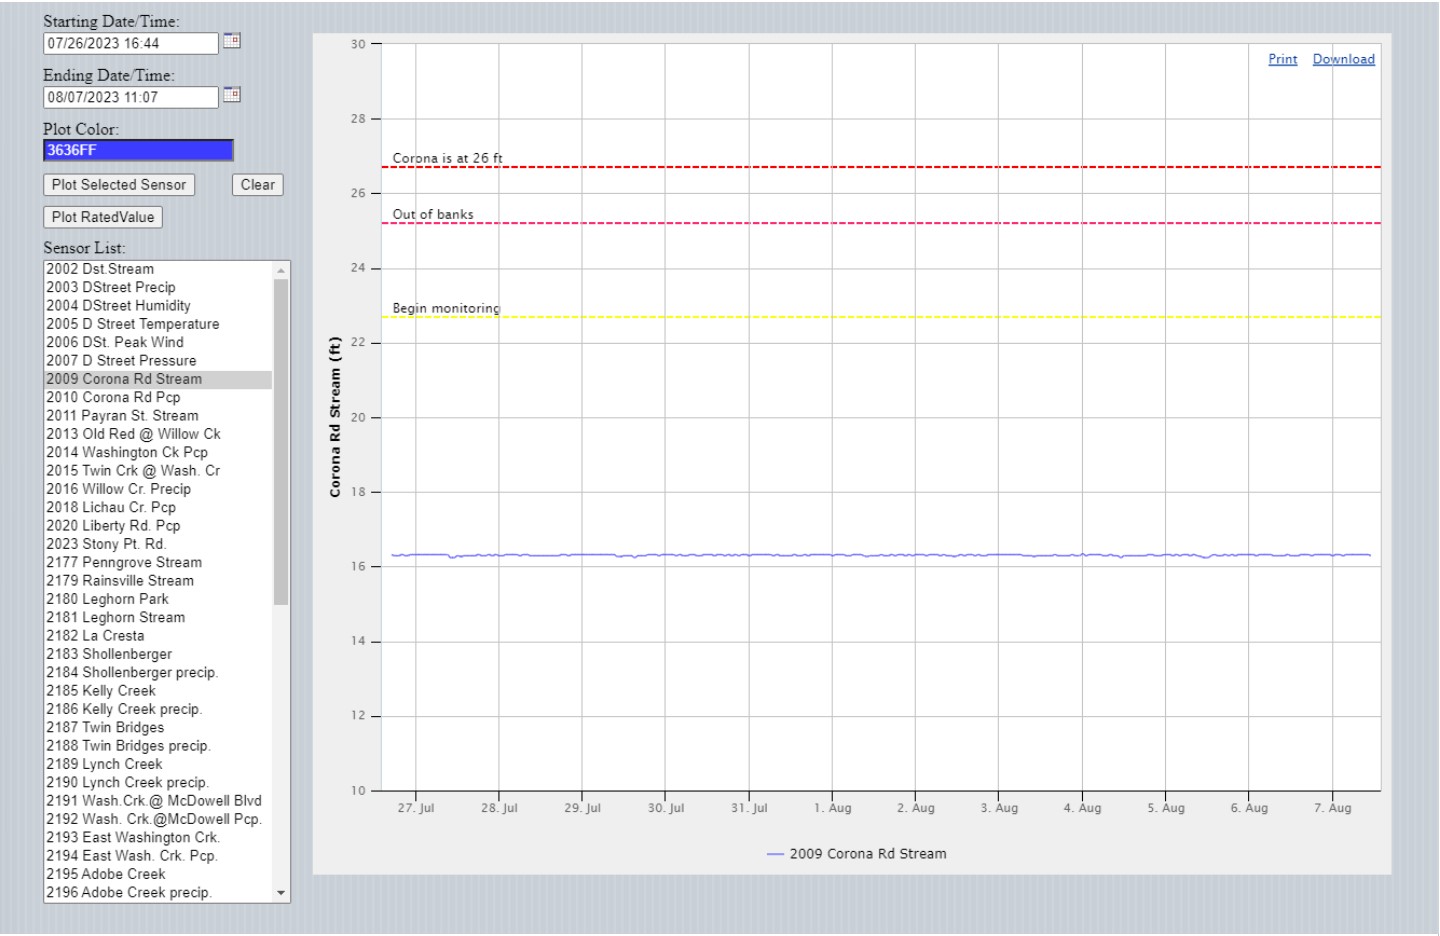
To generate a plot for a single sensor, select the date range, plot color, and, from the "Sensor List", the desired sensor. Click the "Plot Selected Sensor" button.
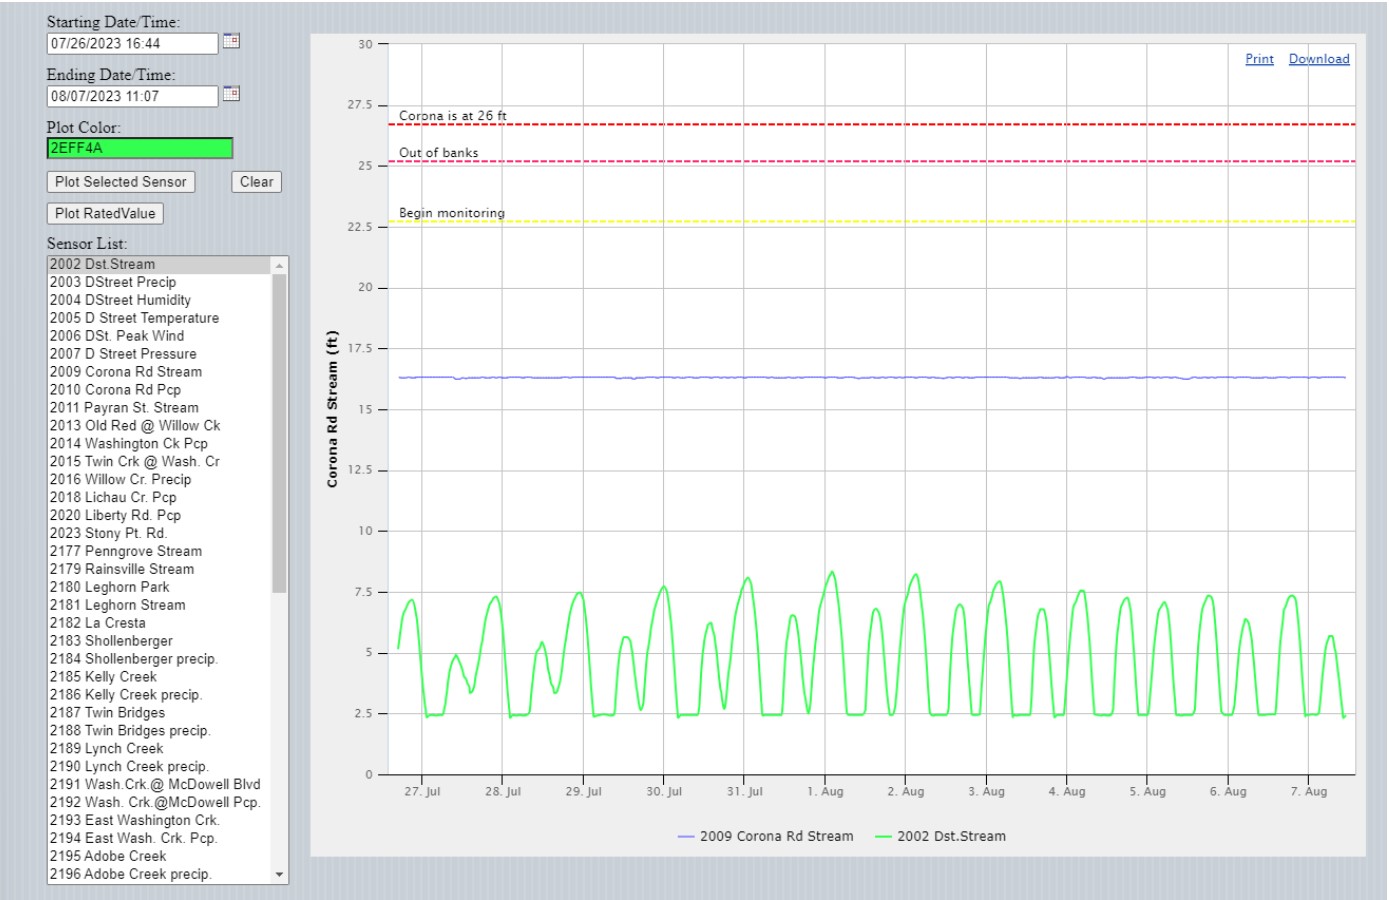
Multiple sensors can be plotted by just selecting another sensor (and color if desired) from the list and clicking the "Plot Selected Sensor" button as shown below: