The DataWise® software suite provides for the visual consistency checking of raingauges in a network, both by distance and elevation.
From the "Charts" drop-down menu, select "Rainfall Plots". The screen below will be displayed.
The ploting is monthly rainfall from the starting date to the ending date for selected precipitation sensors.
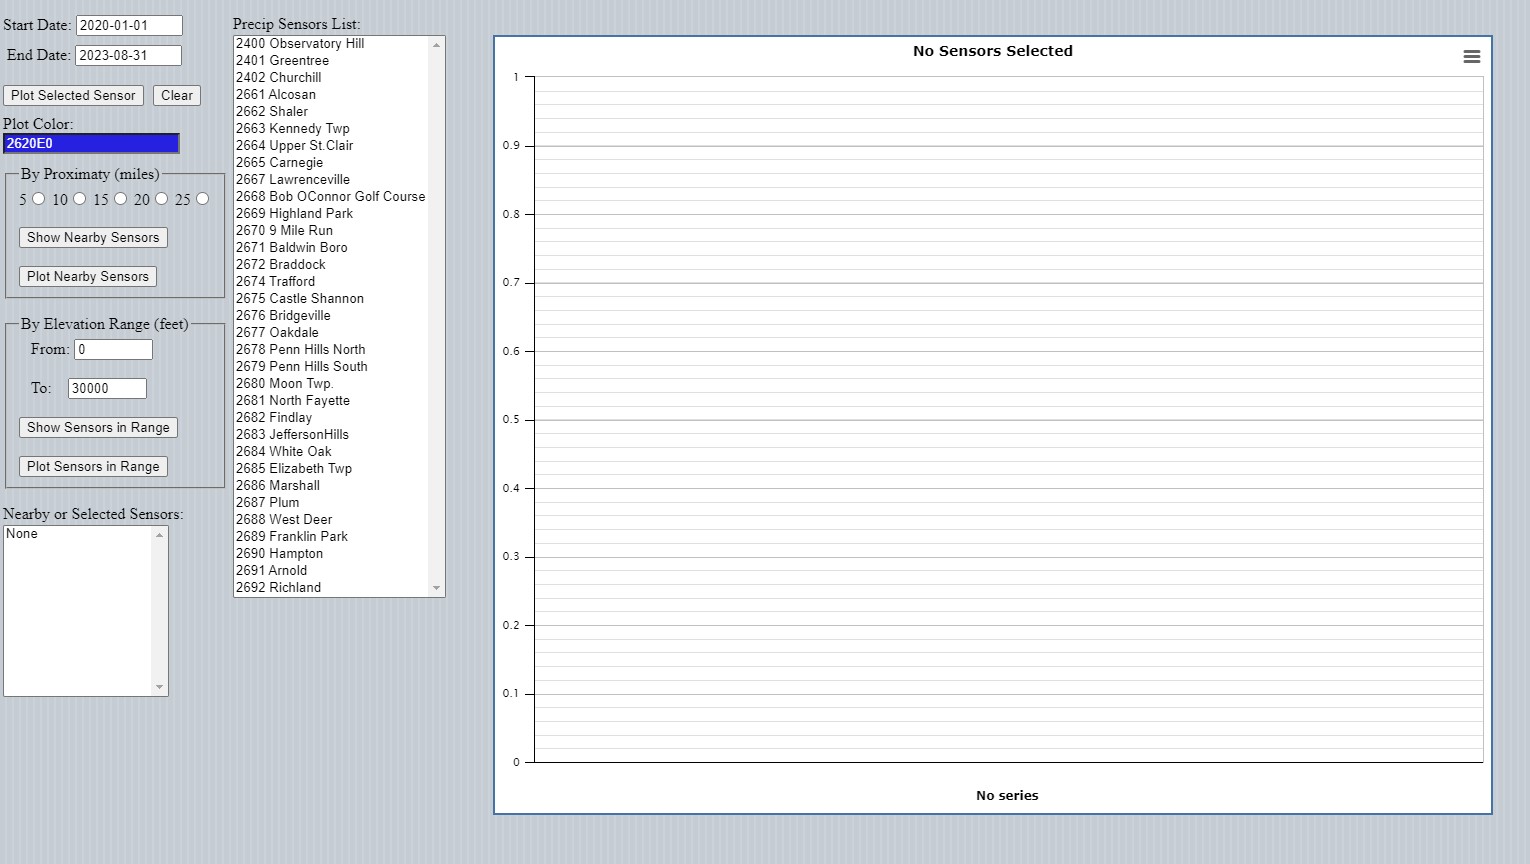
Dialog for rainfall consistency plots.
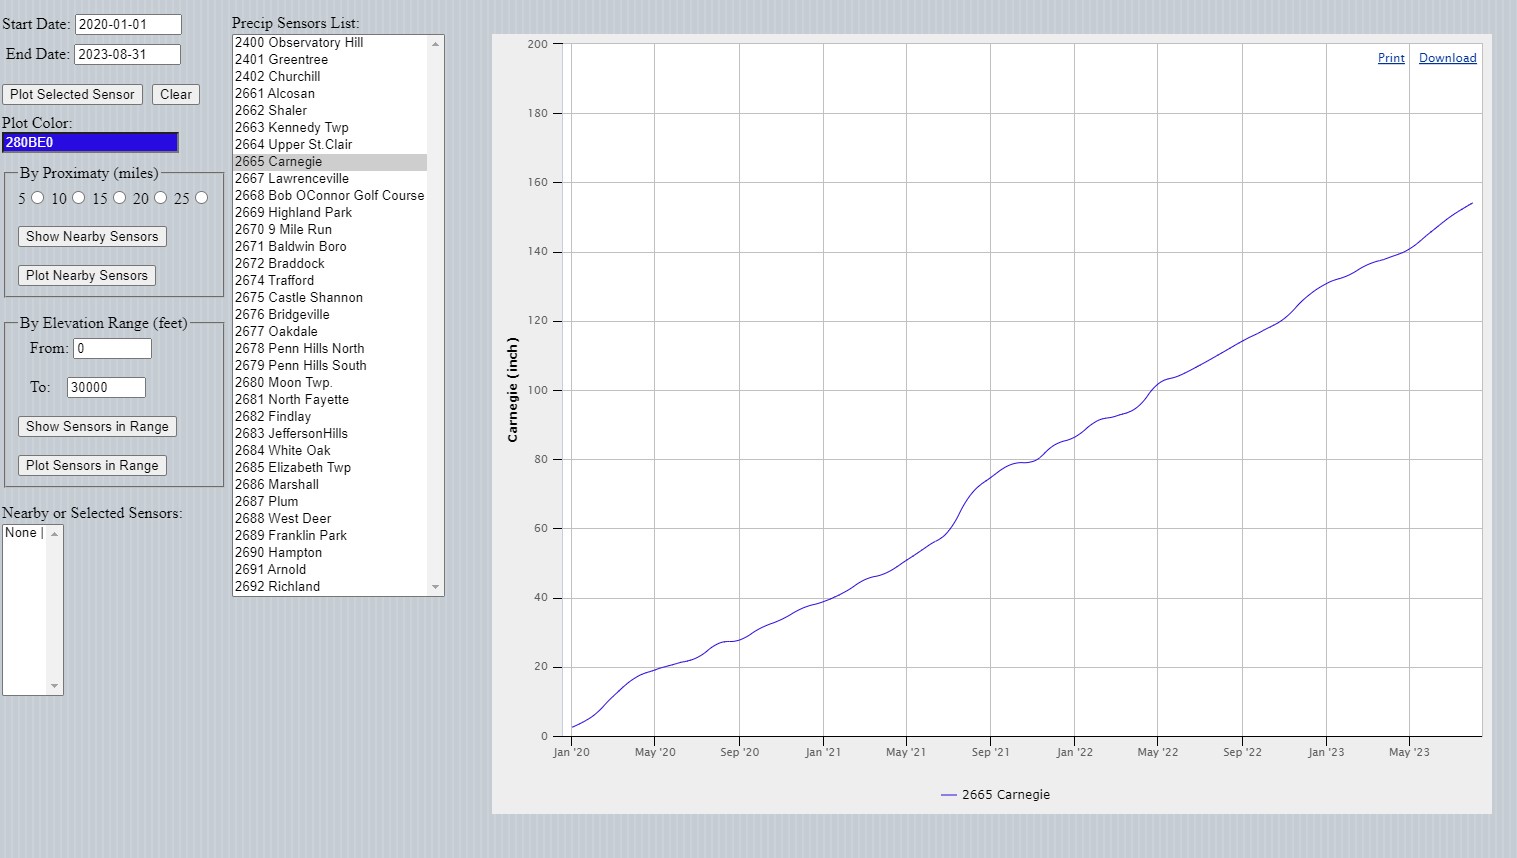
To begin, select a precipitation sensor, say 2665 Carnegie, set the starting and ending dates, and click the "Plot Selected Sensor" button. A plot similarr to that below will be displayed.
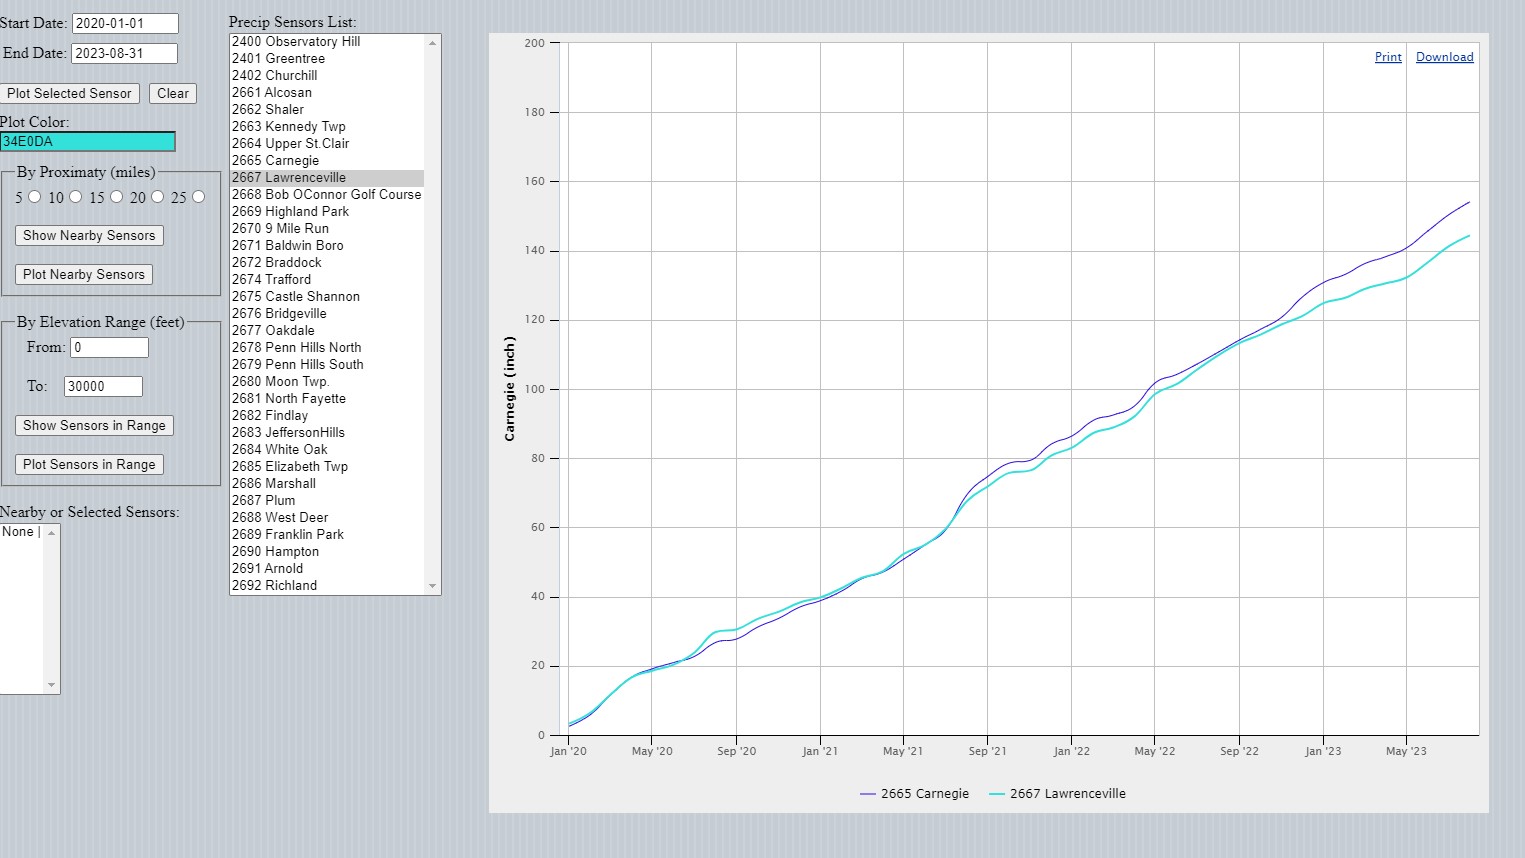
Additional sensors can be added by selecting one, say 2667, and clicking the "Plot Selected Sensor" button again.
Additional sensors can continue to be added following the same procedure, or, a distance in the "By Proximity" box can be selected and data for all sensors within the selected distance will be plotted.
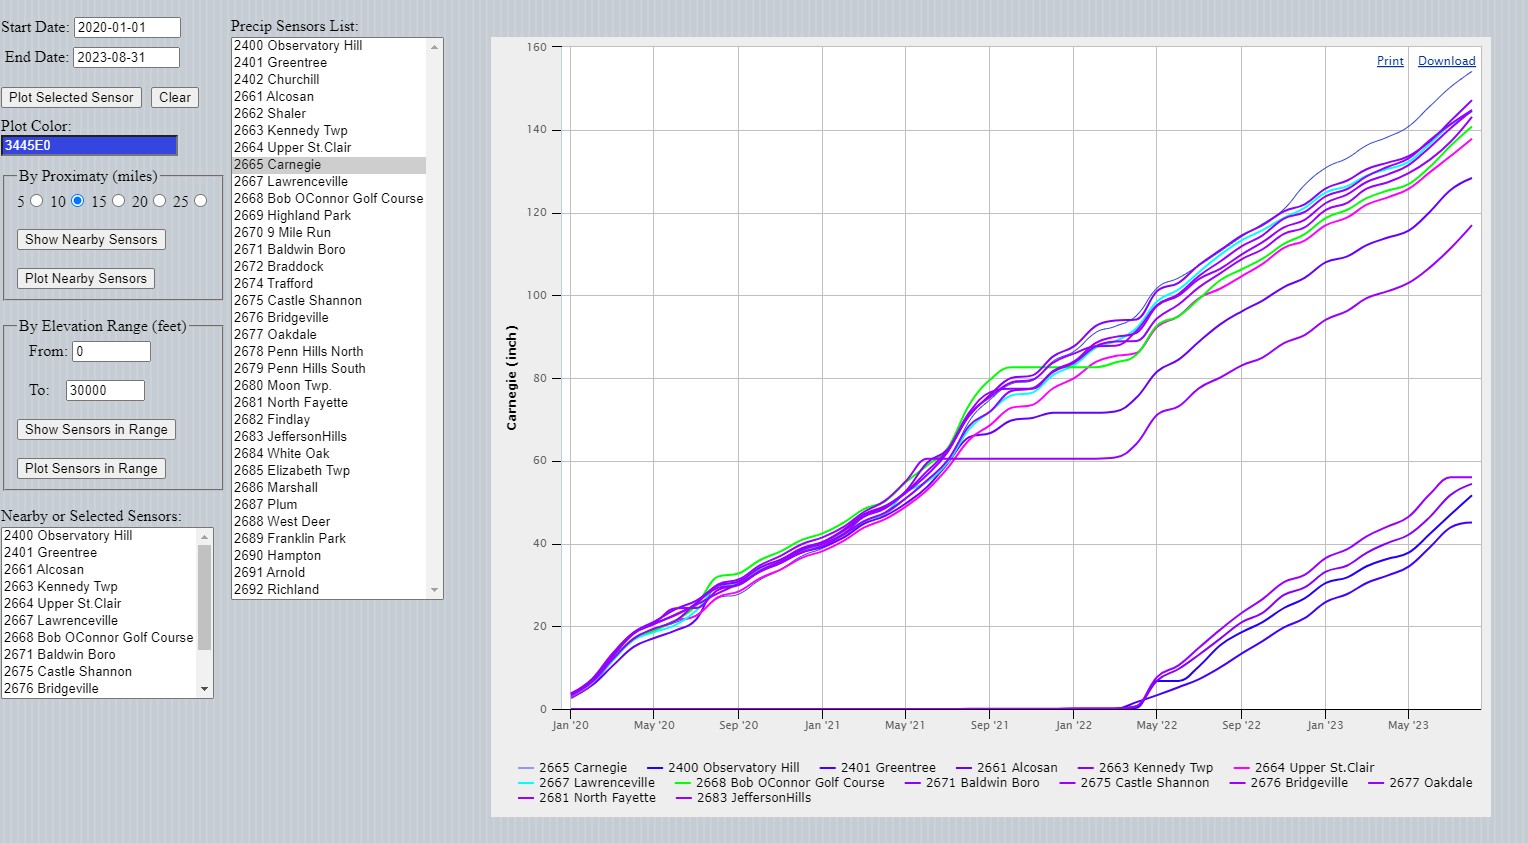
Plotting by elevation range can also be performed. To clear the display and start over, click the "Clear" button.