Defining Significant Levels
The
DataWise® software suite allows for the concept of a significant level. A significant level is used to place reference levels on a plot, place restraints on plot ranges, and to associate a color with a significant level when sensor readings reach the significant level.
To define significant levels, select "Significant Levels" from the "Configure" drop-down menu. The screen shown below will be displayed:
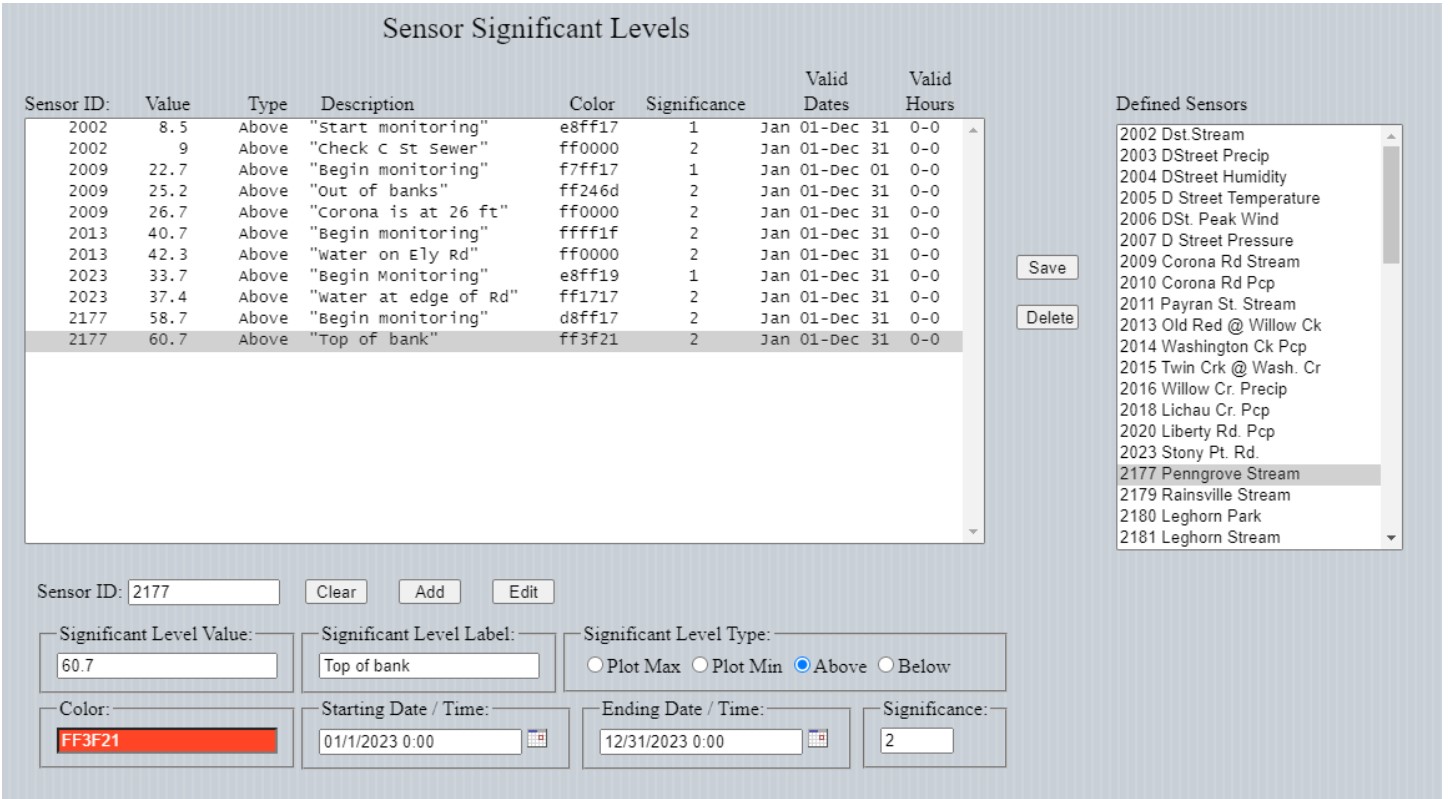
Dialog to display, add, and edit significant levels.
To define a significant level for a sensor, select the desired sensor from the list of defined sensors, then:
Enter a number for the "Significant Level Value".
Enter text for the "Significant Level Label"
Click on the "Significant Level Type".
"Plot Max" specifies the maximum scale of a plot.
"Plot Min" specifies the minimum scale of a plot.
"Above" specifies that sensor readings must exceed the value entered to be in that significant level.
"Below" specifies that sensor readings must be lower than the value entered to be in that significant level.
"Color" specifies the color to be associated with a significant level.
- For time series plots, it is the color of the significant level line placed on the plot.
- For data values shown on a map, it is the color of the text background when the sensor readings are in the significant
level range.
- Colors are specified as RGB (Red, Green, Blue) in hexadecimal. Values can be typed in or the color area can be clicked and colors chosen graphically.
"Starting" and "Ending Date / Time" specify the ranges for which the significant level is valid.
"Significance" specifies to significance of the level. Range from 1 to 5, 5 the highest.
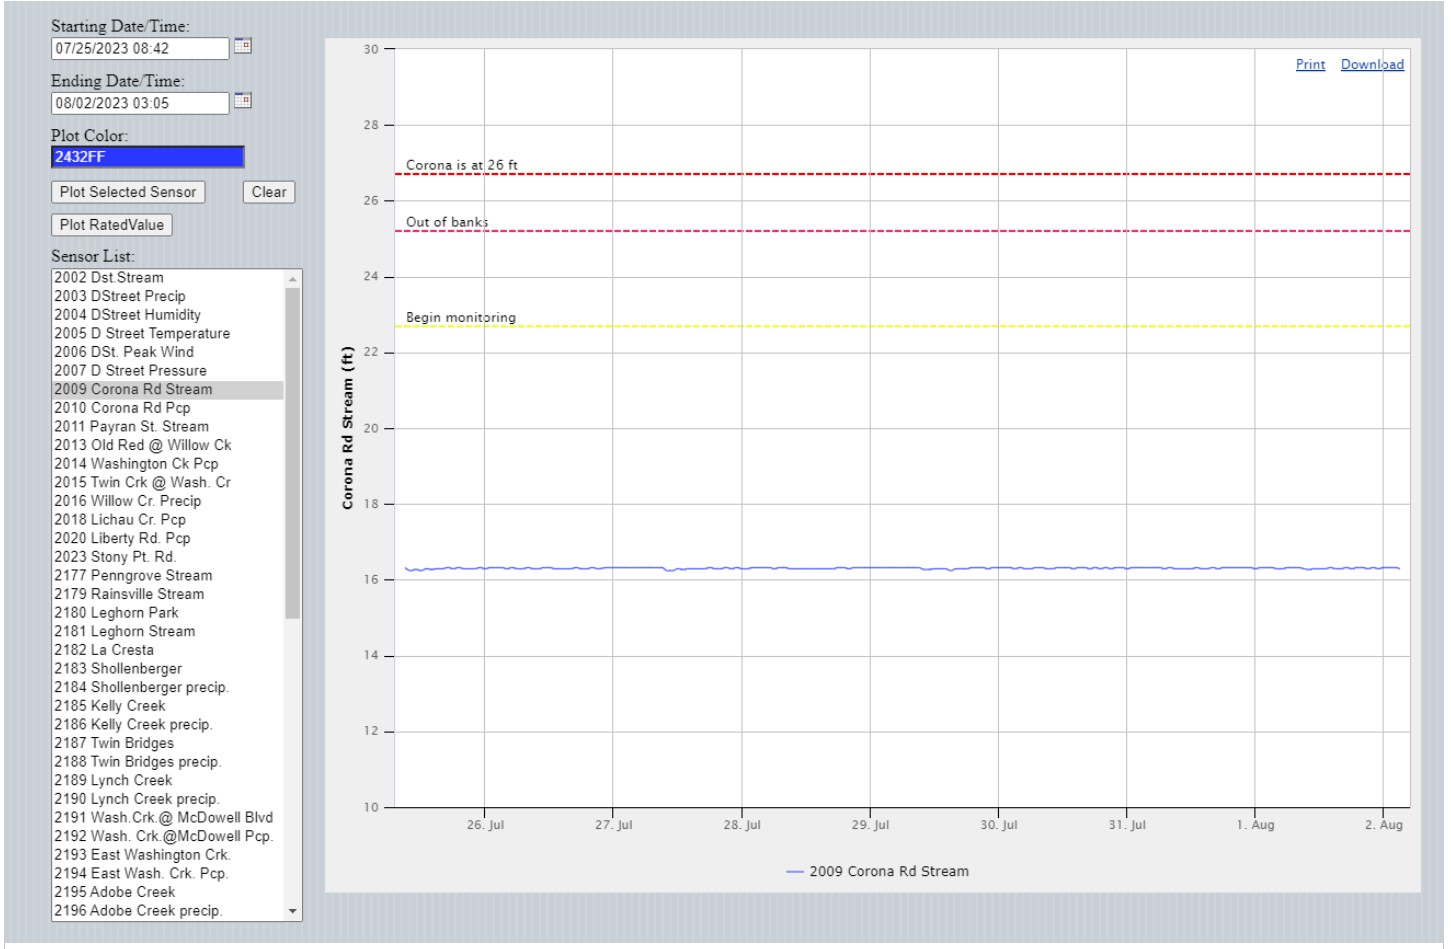
The figure below shows a time-series plot for sensor 2009 using the significant levels defined above.
Note that:
In both the mobile and the desktop browser interfaces, plots for sensor 2009 will show that significance level as a horizontal line (in the color specified) giving a reference point for the plotted values (see the section of plots).
In both the mobile and desktop browser interfaces, the data values will display in the color specified when readings are in the significant level range.