Generate a report by selecting "Statistical Reports" from the "Tabular Data" drop-down menu. A display similar to that below will be shown:
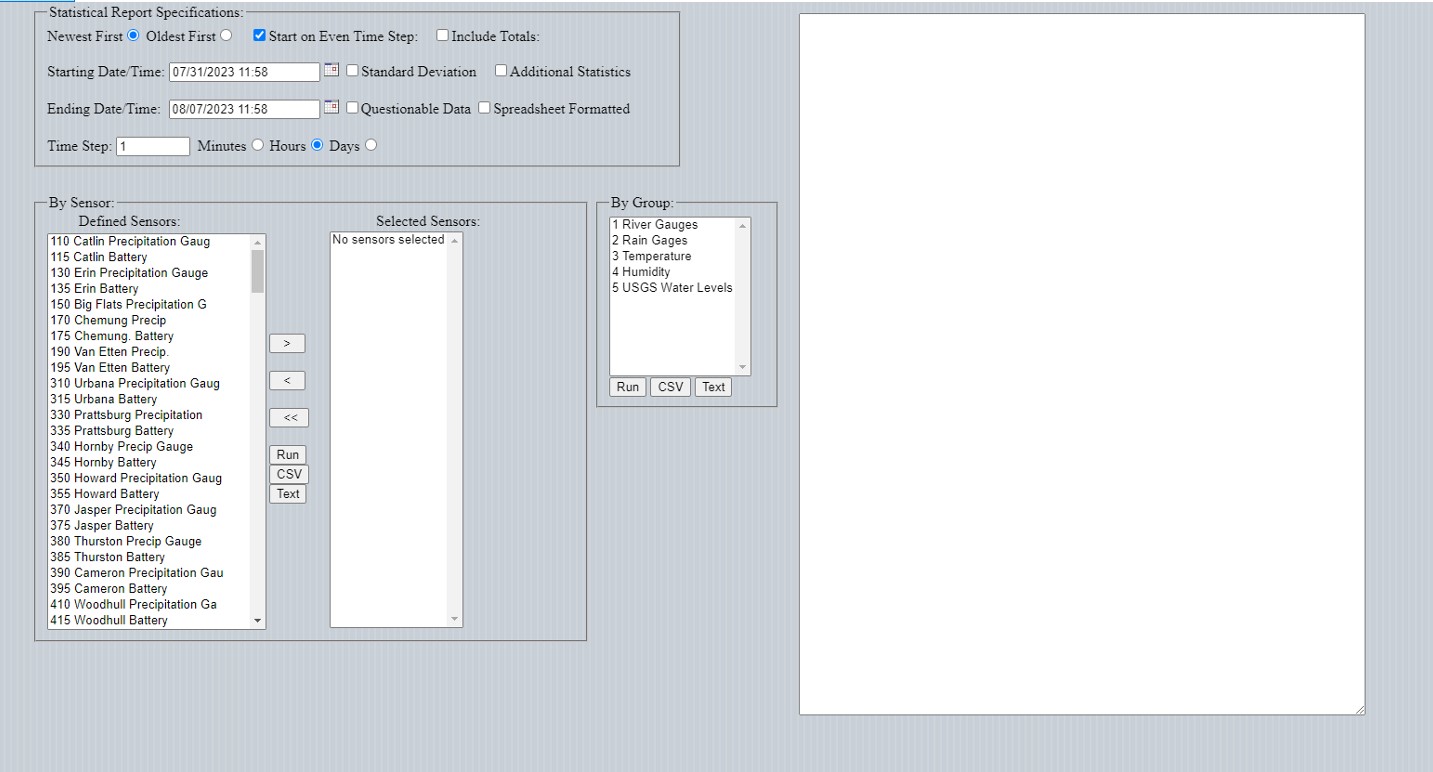
Statistical reports display data by time period (e.g., 15 minute values, 1 hour values, etc.).
Users can choose to:
Selecting the rainfall group with the include totals checked and clicking the "Run" button under the "By Group" list produces the report shown below:
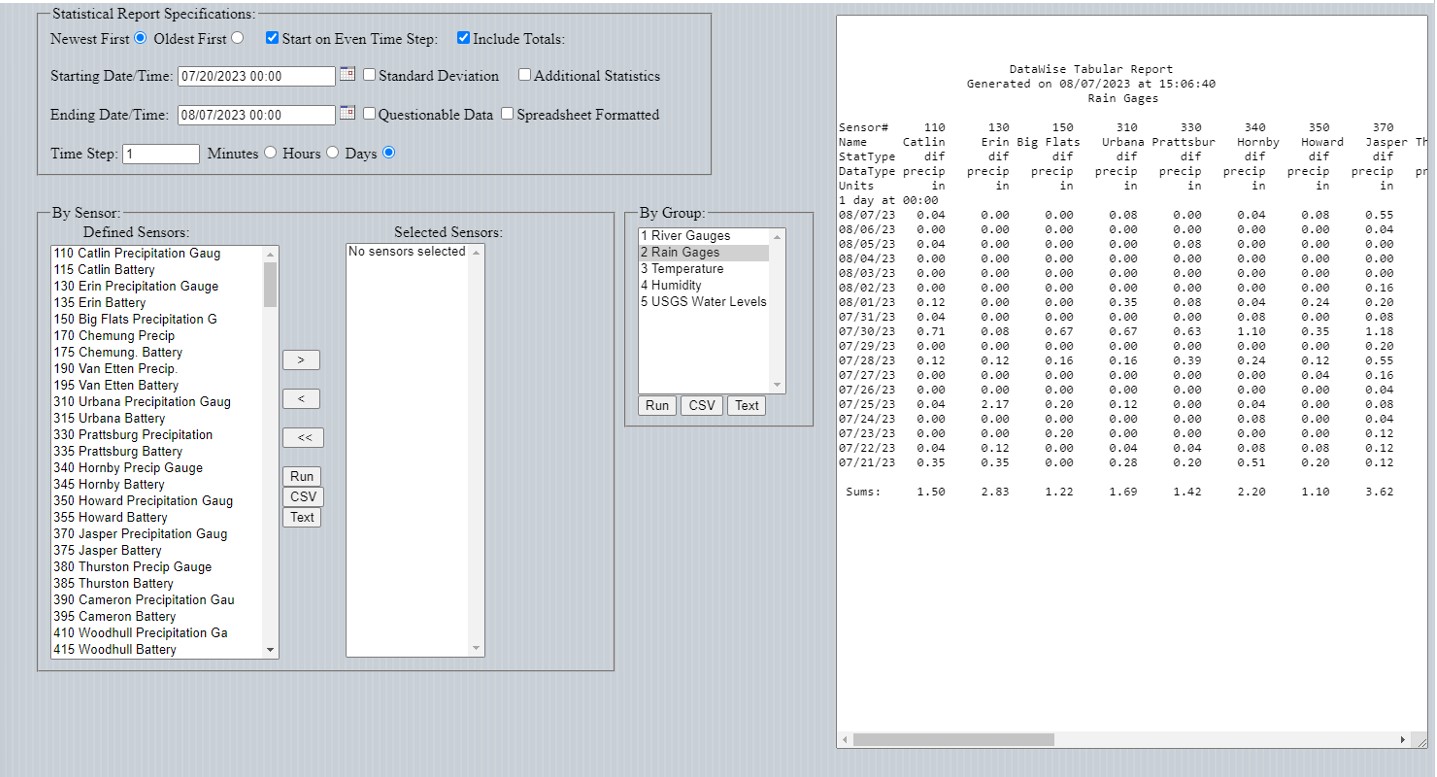
Clicking on the "CSV" button will download a report suitable for importing into a spreadsheet while clicking on "Text" will download a report suitable for a text editor.
Ad hoc reports can be generated by selecting as many sensors from the "Defined Sensors:" list (clicking the > button after each selected) and then clicking on the desired "Run", "CSV", or "Text" button.